

Small caps are having the kind of year that might tempt investors to consider a change in their allocations. The Russell 2000 is up roughly 19.5% year to date on a total return basis, its strongest run in more than two decades, and the breadth story underneath it is legitimate. Capital has moved out of the largest names and down into the next layer.
Sounds great until you look closer at which stocks are leading the rally.
Nearly half the index doesn't earn anything
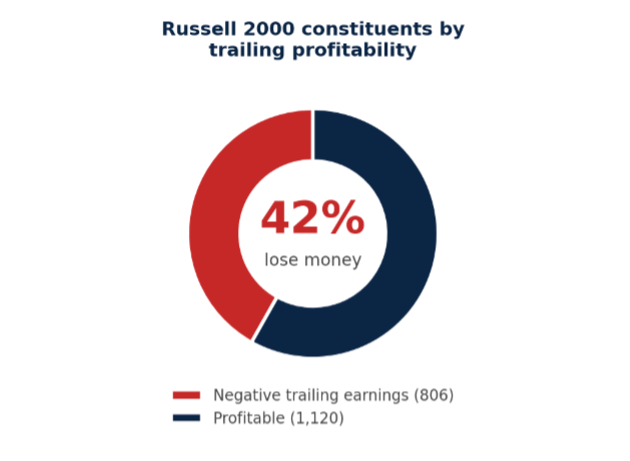
Apollo's count late last year put 806 Russell 2000 constituents on negative trailing earnings against 1,120 profitable ones. Depending on whose screen you run and when you run it, somewhere between 40% and 46% of the index loses money. Two decades ago, this figure was closer to 14%.
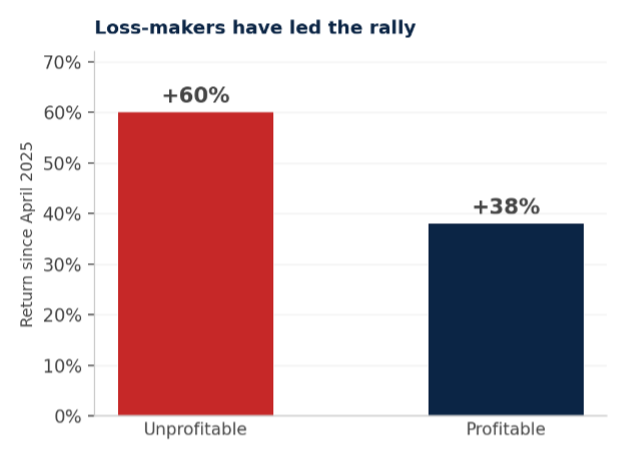
Those are the stocks leading this shift. Apollo's data has unprofitable Russel 2000 names up about 60% since April 2025 against 38% for their profitable counterparts. Torsten Slok, Apollo's chief economist, has been flagging the pattern since 2023 and came back to it again in June, writing that "something is broken in price discovery" when the loss-makers keep winning.
So nearly half the index behind this rally is burning cash, and the gap has been widening for three years. That makes "own small caps" a more nuanced decision than it looks.
The obvious fix barely works
There's a simple answer to this, and capital has already been moving in that direction. The S&P SmallCap 600 requires positive trailing earnings for inclusion. The Russell 2000 screens on size, a US listing, a minimum share price, and enough free float to trade. None of that tells you anything about the health of the assets underneath.
Sounds simple enough. Let's take a look at the numbers.
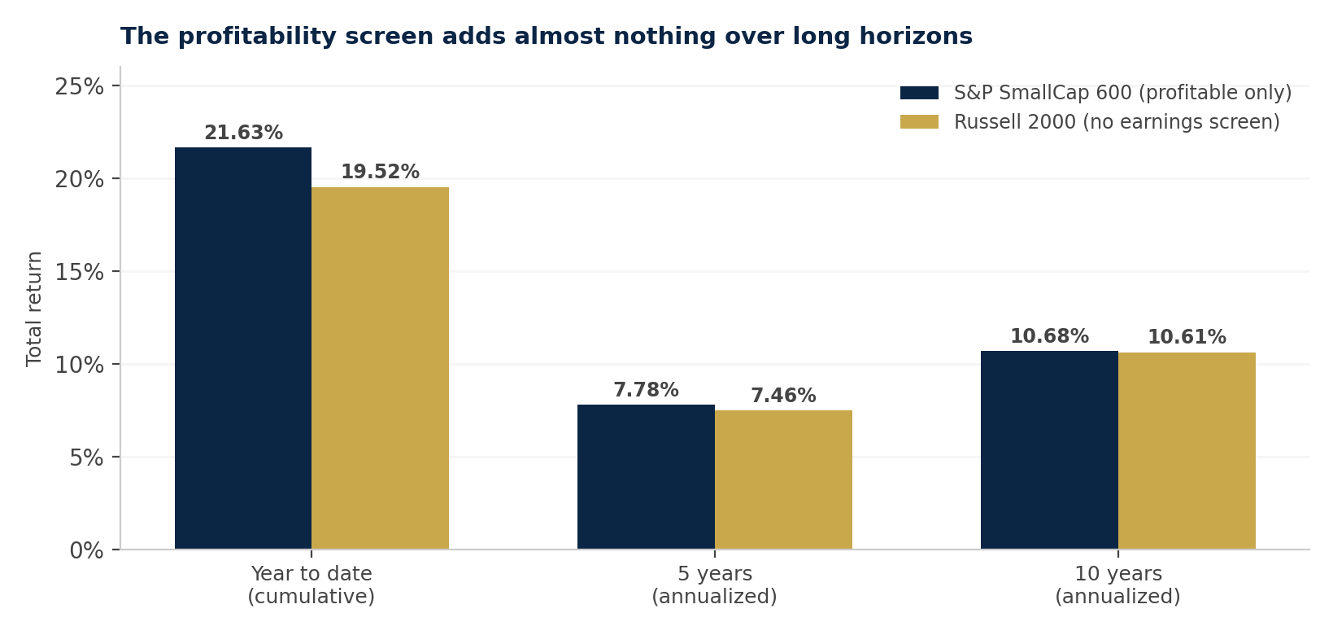
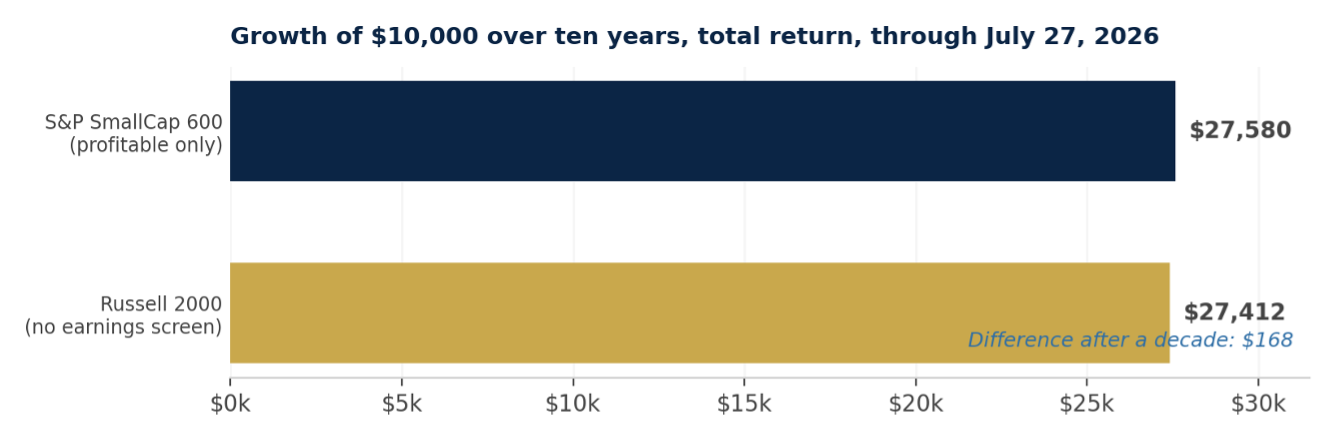
Ten years of screening out every money-losing company in the small-cap universe bought roughly seven basis points a year. Cumulatively, that's 175.8% against 174.1%, a gap of under two percentage points across a decade. The filter is working better recently, well, mostly just in the current year. Across any horizon long enough to matter, it has been close to noise.
Positive earnings aren't enough
The screen underdelivers because it asks a very low-bar question. Positive trailing GAAP earnings distinguish a company that lost money from a company that made a dollar. There is no indication there about whether that dollar justified the capital required to produce it.
Lisa Shalett at Morgan Stanley offers a more detailed explanation of this topic: small-cap companies as a group carry a cost of capital that sits above their return on assets. That gap is the real problem, and it's indifferent between positive or negative earnings. A business growing revenue 25% a year while earning 6% on invested capital against a 9% cost of said capital isn't compounding anything. Instead, every dollar of growth consumes more capital than it returns, and scale only deepens the problem instead of solving it.
Growth itself is abundant right now. Hundreds of companies under $2 billion in market value are posting revenue growth north of 25%, and that population grows any time capital gets cheap enough to fund it. What's scarce is one of the more basic concepts of investing: growth paired with a return on capital that clears its own hurdle. Earn more than your capital costs. Revolutionary stuff. And an earnings screen alone is inadequate to make the distinction.
Looking beyond profitability
We can see this distinction play out in practice, not just in theory. A good example is Avantis U.S. Small Cap Value (AVUV). This fund screens small-cap companies on profitability measured against book value, then tilts allocations toward the stocks trading cheaply relative to that profitability. Rather than asking whether a company earned a dollar, it's more interested in whether the company earns enough to justify what you pay for it.
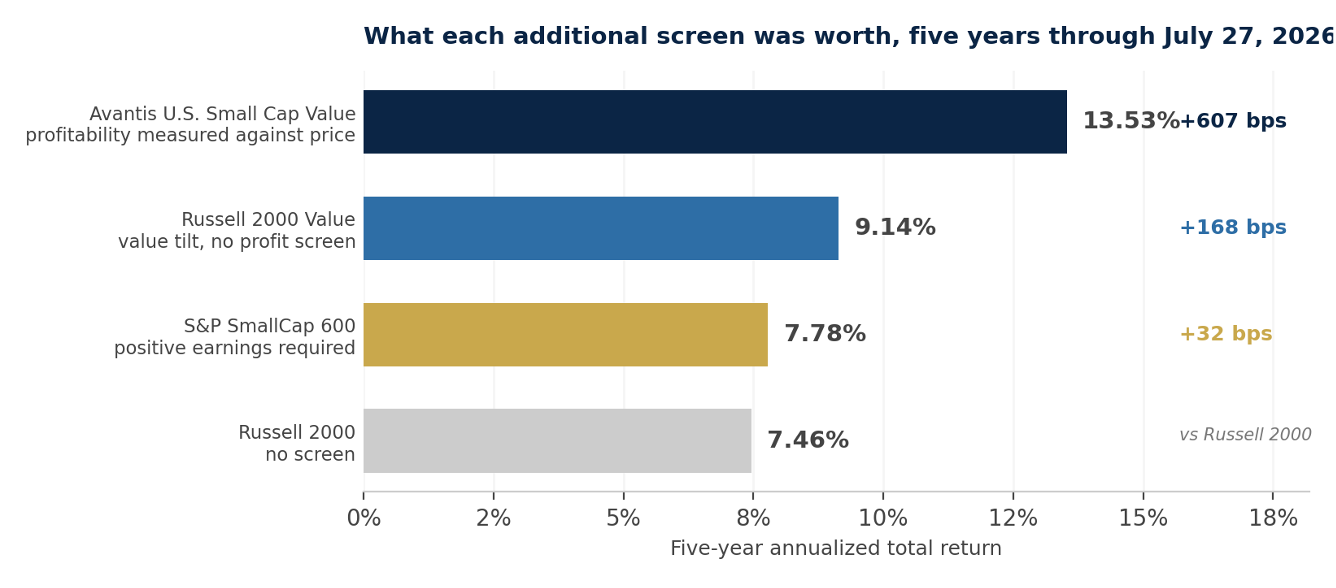
Read the chart from the bottom up. Requiring positive earnings added 32 basis points a year over the plain index. Tilting toward value added 168. Screening profitability against price on top of value added another 439 over the value index alone, and 607 over the plain one.
Thirty-two basis points for asking whether a company earned a dollar. Four hundred thirty-nine for asking whether it earns enough to be worth its price. Small caps are abundant and difficult to assess, but asking the right questions really can make a difference here.
A few caveats to keep in mind aside from past performance. AVUV launched in September 2019, so there is no ten-year record, and the data above has illustrated how misleading short horizons tend to be. The stretch from 2021 and 2026 was unusually kind to small-cap value specifically, so some of that gap could be factor timing rather than process. And it isn't a clean test of profitability by itself: size, value, and profitability all move together inside the portfolio, and returns at this level can't tell you how much each one contributed.
The outliers worth considering
Francis Gannon at Royce argues that a meaningful share of these companies are essential suppliers to the AI and data center buildout, and that the earnings are arriving rather than missing. He may be right about a subset. Small-cap industrials, electrical equipment makers, and power infrastructure businesses sit directly in the path of several hundred billion dollars of annual data center spending. For those, the route from hyperscaler capex to increases in revenue and margins is plausible.
Notice what the argument is, though. It's a claim about specific companies operating in a particular supply chain. Hardly representative of the entire Russell 2000. Buying the index to express it means owning eight hundred loss-makers to reach the few dozen that fit the thesis.
The part that never reaches the index
A second explanation starts from somewhere else entirely. The count of public US-listed companies has fallen by roughly half since the mid-1990s, from somewhere north of 7,000 to around 4,000. Jay Ritter's IPO data puts that median age of a company at listing at about eight years in the mid-1990s against twelve to fourteen more recently, and median revenue at IPO at $16 million in 1980 against $218 million by 2024. Companies now run through most of their high-growth phase before an ordinary investor can buy in.
That is part of why we utilize private market funds for eligible clients alongside our small-cap public allocation. Is it a guarantee to hit those large multiples on all the companies? No, but from what we see today, the odds are higher today in the private markets than in the public markets. The tradeoffs are notable and worth stating plainly: eligibility is restricted, liquidity comes through periodic tender offers rather than a daily market, fees sit well above an ETF, and valuations rest on estimates rather than closing prices.
The premise deserves a challenge. Vanguard analyzed FactSet data on IPOs and public companies from 2003 through 2024. They found the average age at IPO hasn't moved materially, and that the shrinkage in listing counts sits almost entirely in microcaps between roughly $50 million and $300 million. The investable large, mid, and small-cap universe, by their measure, is close to where it was.
Much of the disagreement comes down to where you start counting. Starting in the mid-1990s anchors the data to a peak in listings. But say Vanguard has it right. That conclusion still points somewhere uncomfortable for anyone holding the index. If the companies that left public markets were the very smallest ones, they left from the same end of the size distribution where quality thins out fastest. That end is exactly where the 806 loss-makers sit today.
What this means for investors
The clearest interpretation is that this rally has been the market paying for optionality rather than for performance. Investors are buying the possibility that these companies eventually earn something, not evidence that they do. That can run a long time, especially while the capex cycle holds, and trying to call the reversal is a losing game. We'll sit that one out. Anyone who thinks they can is welcome to try. I can't speak for the rest of AFE, but I do enjoy rooting for an underdog.
What does change is how the exposure gets built. If the durable return in this asset class sits with companies whose growth converts into returns on capital, then the passive vehicle is structurally mismatched to the opportunity, and the cheap profitability filter is only a marginal improvement on it. Seven basis points a year is what an index inclusion rule is worth here.
The work that goes into separating these businesses is unglamorous. Return on invested capital measured against the cost of that capital. Free cash flow conversion measured against reported earnings. Margin direction measured against the industry rather than against the company's own history. None of that is visible in a rule about whether last year's net income printed above zero.
Small caps as a category are having a tremendous year. Whether they're worth owning is a separate matter, and it comes down to which ones you own. Asking a few extra questions can make a big difference in your overall portfolio quality.
Sources and methodology
Index return figures are calculated from the largest exchange-traded fund tracking each index, using dividend-adjusted closing prices, for the periods ending July 27, 2026. Year-to-date figures measure from the December 31, 2025 close. Data provider: Financial Modeling Prep. Constituent profitability counts, the profitable-versus-unprofitable performance comparison, and the price discovery commentary are attributed to Apollo Global Management. Cost of capital and return on assets commentary is attributed to Morgan Stanley. The AI supply chain counterargument is attributed to Royce Investment Partners. Fund strategy description and expense ratio are sourced from Avantis Investors fund materials. IPO age and revenue figures are attributed to Jay R. Ritter, University of Florida. Listed-company counts are drawn from multiple public sources and vary by methodology. The counterargument on IPO age and listing counts is attributed to Vanguard, from its analysis of FactSet data covering 2003 through 2024.